| Please note that this page is archived because the study has fixed dates. For more recent information, please see ProCon’s “U.S. Executions” and “Most Recent Executions in Each U.S. State.“
M. Watt Espy, Jr. and John Ortiz Smykla gathered data from state Department of Corrections records, newspapers, county histories, proceedings of state and local courts, holdings of historical societies, museums, and other listings of executions to compile a 32-year study of 15,269 executions performed from 1608-2002 under legal civil authority in the US, or within territories which later became part of the US is the source material for this resource. The data was then broken down by 21 different variables such as race, age, jurisdiction, type of violation, crime committed, method of execution, day, month, and year of execution, order of execution, state where execution took place, year of statehood, gender, and occupation of the person executed. The data begins with the first official American execution in 1608 when Captain George Kendall of the Jamestown colony was executed by firing squad for the crime of mutiny. The data ends in 2002 when the study was considered complete. The ESPY list is considered the most comprehensive one of its kind, yet it is still incomplete because some executions were not recorded at all, and some records may have been lost or destroyed over time. |
| I. Total Number of US Executions, 1608-2002 | ||||||||||||||||||||||||||||||||||||||||
| 15,269 total US executions shown mostly in 25-year increments. | ||||||||||||||||||||||||||||||||||||||||
 |
||||||||||||||||||||||||||||||||||||||||
|
||||||||||||||||||||||||||||||||||||||||
| II. Top 20 Occupations of the Executed, 1608-2002 | ||
| The occupation of the executed individual was recorded in 7,555 (49.5%) of the 15,269 US executions between 1608 and 2002. All terminology used for occupations came directly from the original study, “Executions in the United States, 1608-2002: The ESPY File.” | ||
| 1. Slave – 1,748 (11.5%) | 11. Criminal – 75 | |
| 2. Laborer – 585 (3.8%) | 12. Pirate – 68 | |
| 3. Farmhand – 369 (2.4%) | 13. Tenant Farmer – 67 | |
| 4. Farmer – 347 (2.2%) | 14. Carpenter – 54 | |
| 5. Farm Laborer – 168 (1.1%) | 15. Housewife – 50 | |
| 6. Miner – 130 | 16. Truck Driver – 49 | |
| 7. Soldier – 118 | 17. Cook – 47 | |
| 8. Gangster – 110 | 18. Railroad Worker – 43 | |
| 9. Seaman – 92 | 19. Freedman – 42 | |
| 10. Tenant Farmer – 77 | 20. Ranch Hand – 39 | |
|
Other Interesting Occupations of People Executed (in alphabetical order): Attorney (12), Baseball Player (5), Bootlegger (35), Boxer (3), Clergy (16), Clown (1), Guerilla (4), Jockey (6), Physician (19), Playboy (2), Policeman (11), Preacher (15), Teamster (6), Voodoo Doctor (2)
|
||
| III. Executions by Race, 1608-2002 | |||||||||||||||||||||||||||||||||||||||||||||
| The race of the executed individual was recorded in 14,555 (95.3%) of the 15,269 US executions between 1608 and 2002. | |||||||||||||||||||||||||||||||||||||||||||||
| Total Number of US Executions by Race from 1608-2002 | |||||||||||||||||||||||||||||||||||||||||||||
 |
|||||||||||||||||||||||||||||||||||||||||||||
|
|||||||||||||||||||||||||||||||||||||||||||||
| IV. Executions by Crime, 1608-2002 | |
| The crime committed by the executed individual was recorded in 14,810 (97.0%) of the 15,269 US executions between 1608 and 2002. All terminology used for type of crime committed came directly from the original study, “Executions in the United States, 1608-2002: The ESPY File.” | |
| 1. Murder1 – 12,111 (81.8%) | 16. Witchcraft – 35 |
| 2. Rape2 – 988 (6.7%) | 17. Counterfeiting – 31 |
| 3. Slave Revolt – 277 (1.9%) | 18. Spying/Espionage – 27 |
| 4. House Break-in Burglary – 251 (1.7%) | 19. Theft/Stealing – 23 |
| 5. Robbery – 158 (1.1%) | 20. Forgery – 21 |
| 6. Attempted Murder – 144 | 21. Aiding a Runaway Slave – 20 |
| 7. Piracy – 130 | 22. Burglary/Attempted Rape – 16 |
| 8. Unspecified Felony – 107 | 23. Sodomy/Buggery/Bestiality – 15 |
| 9. Conspiracy to Murder – 99 | 24. Kidnapping – 11 |
| 10. Arson – 97 | 25. Guerilla Activity – 7 |
| 11. Poisoning – 59 | 26. Concealing Birth – 4 |
| 12. Horse Stealing – 51 | 27. Rioting – 4 |
| 13. Treason – 43 | 28. Adultery – 2 |
| 14. Desertion – 40 | 29. Prison Break/Kidnap – 2 |
| 15. Accessory to Murder – 36 | 30. Criminal Assault – 1 |
| 1. Murder: This category includes murder, arson/murder, kidnap/murder, murder/burglary, murder/rape/robbery, rape/murder, and robbery/murder. 2. Rape: This category includes rape and rape/robbery. |
|
| V. Executions by Method, 1608-2002 | |||||||||||||||||||||||||||||||||||||||||||||||||||||||||||||||||||||||||||||||||||||||||||||||||||||||||||||||||||||||||||||||||||||||||||||||||
| The method of execution was recorded in 15,202 (99.6%) of the 15,269 US executions between 1608 and 2002. | |||||||||||||||||||||||||||||||||||||||||||||||||||||||||||||||||||||||||||||||||||||||||||||||||||||||||||||||||||||||||||||||||||||||||||||||||
|
|||||||||||||||||||||||||||||||||||||||||||||||||||||||||||||||||||||||||||||||||||||||||||||||||||||||||||||||||||||||||||||||||||||||||||||||||
| VI. Executions by Method, 1900-1999 | |||||||||||||||||||||||||||||||||||||||||||||||||||||||||||||||||||||||||||||||||||||||||||||||||
| The method of execution was recorded in 8,141 (100%) of US executions between 1900 and 1999. | |||||||||||||||||||||||||||||||||||||||||||||||||||||||||||||||||||||||||||||||||||||||||||||||||
 |
|||||||||||||||||||||||||||||||||||||||||||||||||||||||||||||||||||||||||||||||||||||||||||||||||
|
|||||||||||||||||||||||||||||||||||||||||||||||||||||||||||||||||||||||||||||||||||||||||||||||||
| VII. Executions by Age, 1608-2002 | ||||||||||||||||||||||||
| The age of the executed individual was recorded in 7,311 (47.9%) of the 15,269 US executions between 1608 and 2002. | ||||||||||||||||||||||||
 |
||||||||||||||||||||||||
* Of the 578 people aged 10-19 who were executed the breakdown is as follows: age 10 (0), age 11 (0), age 12 (3), age 13 (3), age 14 (9), age 15 (6), age 16 (38), age 17 (100), age 18 (175), age 19 (244). |
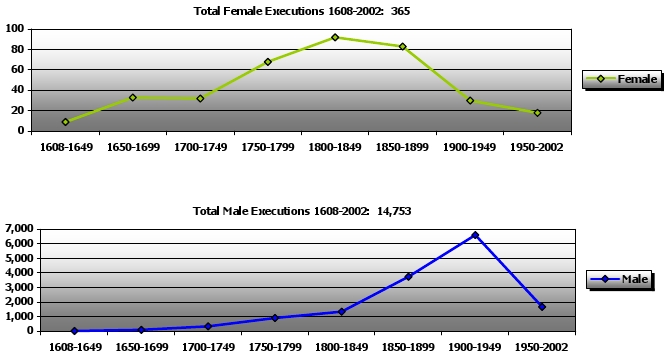
| VIII. Executions by Gender, 1608-2002 | ||||||
| The gender of the executed individual was recorded in 15,118 (99.0%) of the 15,269 US executions between 1608 and 2002. |
 |
||||||||||||||||||||||||||||||||||
|
||||||||||||||||||||||||||||||||||
| IX. Executions by State & Year, 1608-2002 | |||||||||
| The state in which the individual was executed was recorded in all 15,269 US executions between 1608 and 2002. States are listed in order of the most executions down to the lowest number of executions. The time periods in this table are broken down as follows: 17th century (1608-1699); 18th century (1700-1799); early 19th century to the end of the Civil War (1800-1865); 19th century after Civil War (1866-1899); early 20th century ending in 1935, the year the largest number of US executions occurred (1900-1935); mid-20th century to 1972, the year the Furman vs. Georgia decision placed a moratorium on the death penalty (1935-1972); post-1972, in 1976 the US Supreme Court re-affirmed the constitutionality of the death penalty (1973-1991); and late 20th century to 2002, in 1993 the US Supreme Court ruled in Herrera v. Collins that a death-row inmate is not ordinarily entitled to relief where a claim of innonence is based on newly discovered evidence, unless the claim also includes an independent constitutional violation (1992-2002) |
|||||||||
| 1608-1699 | 1700-1799 | 1800-1865 | 1866-1899 | 1900-1935 | 1936-1972 | 1973-1991 | 1992-2002 | Total | |
| 1. Virginia | 10 | 386 | 481 | 96 | 223 | 81 | 11 | 73 | 1,361 |
| 2. New York | 8 | 167 | 156 | 155 | 408 | 236 | 0 | 0 | 1,130 |
| 3. Pennsylvania | 1 | 202 | 108 | 185 | 443 | 101 | 0 | 3 | 1,043 |
| 4. Texas | 0 | 0 | 41 | 221 | 258 | 235 | 38 | 238 | 1,031 |
| 5. Georgia | 0 | 18 | 84 | 223 | 343 | 282 | 14 | 12 | 976 |
| 6. North Carolina | 0 | 131 | 133 | 112 | 207 | 201 | 3 | 16 | 803 |
| 7. Alabama | 0 | 0 | 262 | 133 | 197 | 116 | 8 | 17 | 733 |
| 8. California | 0 | 5 | 111 | 127 | 239 | 227 | 0 | 10 | 719 |
| 9. South Carolina | 0 | 93 | 127 | 143 | 165 | 113 | 3 | 24 | 668 |
| 10. Louisiana | 0 | 61 | 142 | 135 | 204 | 90 | 19 | 7 | 658 |
| 11. Arkansas | 0 | 0 | 29 | 202 | 158 | 89 | 2 | 22 | 502 |
| 12. Ohio | 0 | 1 | 44 | 85 | 188 | 120 | 0 | 5 | 443 |
| 13. Kentucky | 0 | 8 | 122 | 92 | 123 | 79 | 0 | 2 | 426 |
| 14. Florida | 0 | 0 | 16 | 30 | 118 | 150 | 26 | 27 | 367 |
| 15. New Jersey | 8 | 76 | 35 | 55 | 143 | 44 | 0 | 0 | 361 |
| 16. Illinois | 0 | 1 | 50 | 93 | 157 | 47 | 1 | 11 | 360 |
| 17. Mississippi | 0 | 0 | 26 | 81 | 128 | 116 | 4 | 2 | 357 |
| 18. Massachusetts | 99 | 102 | 55 | 24 | 49 | 16 | 0 | 0 | 345 |
| 19. Missouri | 0 | 0 | 49 | 126 | 66 | 44 | 5 | 50 | 340 |
| 20. Tennessee | 0 | 4 | 69 | 83 | 101 | 78 | 0 | 0 | 335 |
| 21. Maryland | 15 | 43 | 65 | 74 | 55 | 57 | 0 | 3 | 312 |
| 22. Oklahoma | 0 | 0 | 3 | 36 | 62 | 31 | 1 | 50 | 183 |
| 23. West Virginia | 0 | 6 | 37 | 21 | 63 | 28 | 0 | 0 | 155 |
| 24. Indiana | 0 | 0 | 33 | 26 | 41 | 31 | 2 | 7 | 140 |
| 25. Arizona | 0 | 0 | 1 | 25 | 46 | 32 | 0 | 22 | 126 |
| 26. Connecticut | 12 | 16 | 17 | 16 | 46 | 19 | 0 | 0 | 126 |
| 27. Oregon | 0 | 0 | 21 | 33 | 50 | 18 | 0 | 2 | 124 |
| 28. DC | 0 | 0 | 12 | 28 | 47 | 31 | 0 | 0 | 118 |
| 29. Washington | 0 | 0 | 3 | 20 | 46 | 36 | 0 | 4 | 109 |
| 30. Colorado | 0 | 0 | 6 | 30 | 37 | 28 | 0 | 1 | 102 |
| 31. Deleware | 2 | 8 | 7 | 20 | 18 | 7 | 0 | 13 | 75 |
| 32. Montana | 0 | 0 | 1 | 31 | 36 | 3 | 0 | 2 | 73 |
| 33. Nevada | 0 | 0 | 3 | 17 | 18 | 23 | 5 | 7 | 73 |
| 34. New Mexico | 0 | 0 | 9 | 30 | 28 | 6 | 0 | 0 | 73 |
| 35. Minnesota | 0 | 0 | 42 | 17 | 7 | 0 | 0 | 0 | 66 |
| 36. Kansas | 0 | 0 | 7 | 9 | 1 | 40 | 0 | 0 | 57 |
| 37. Rhode Island | 4 | 44 | 4 | 0 | 0 | 0 | 0 | 0 | 52 |
| 38. Hawaii | 0 | 0 | 1 | 6 | 37 | 5 | 0 | 0 | 49 |
| 39. Utah | 0 | 0 | 5 | 7 | 18 | 13 | 3 | 3 | 49 |
| 40. Iowa | 0 | 0 | 9 | 4 | 17 | 15 | 0 | 0 | 45 |
| 41. Nebraska | 0 | 0 | 0 | 14 | 16 | 4 | 0 | 0 | 34 |
| 42. Idaho | 0 | 0 | 3 | 14 | 6 | 3 | 0 | 1 | 27 |
| 43. Vermont | 0 | 1 | 6 | 11 | 5 | 3 | 0 | 0 | 26 |
| 44. New Hampshire | 0 | 6 | 5 | 10 | 2 | 1 | 0 | 0 | 24 |
| 45. Wyoming | 0 | 0 | 0 | 6 | 11 | 5 | 0 | 1 | 23 |
| 46. Maine | 1 | 7 | 7 | 6 | 0 | 0 | 0 | 0 | 21 |
| 47. South Dakota | 0 | 0 | 0 | 9 | 5 | 1 | 0 | 0 | 15 |
| 48. Michigan | 2 | 5 | 5 | 0 | 0 | 1 | 0 | 0 | 13 |
| 49. Alaska | 0 | 0 | 0 | 4 | 5 | 3 | 0 | 0 | 12 |
| 50. North Dakota | 0 | 0 | 0 | 3 | 5 | 0 | 0 | 0 | 8 |
| 51. Wisconsin | 0 | 0 | 1 | 0 | 0 | 0 | 0 | 0 | 1 |
| Totals: | 162 | 1,391 | 2,453 | 2,928 | 4,646 | 2,909 | 145 | 635 | 15,269 |
| 1608-1699 | 1700-1799 | 1800-1865 | 1866-1899 | 1900-1935 | 1936-1972 | 1973-1991 | 1992-2002 | ||
| X. Executions by State & Race, 1608-2002 | ||||||||||||
| The state in which the individual was executed in was recorded in all 15,269 US executions between 1608 and 2002. States are listed in order of the most executions down to the lowest number of executions. | ||||||||||||
| Asian | Black | Hispanic | Native American | White | Other/ Unknown |
Total | ||||||
| 1. Virginia | 0 | 1,118 (82.2%) | 7 (0.5%) | 3 (0.2%) | 218 (16.0%) | 15 (1.1%) | 1,361 | |||||
| 2. New York | 10 (0.9%) | 227 (20.1%) | 20 (1.8%) | 8 (0.7%) | 774 (68.5%) | 91 (8.0%) | 1,130 | |||||
| 3. Pennsylvania | 3 (0.3%) | 221 (21.2%) | 2 (0.2%) | 3 (0.3%) | 686 (65.8%) | 128 (12.2%) | 1,043 | |||||
| 4. Texas | 2 (0.2%) | 546 (52.9%) | 112 (10.9%) | 5 (0.5%) | 349 (33.9%) | 17 (1.6%) | 1,031 | |||||
| 5. Georgia | 0 | 734 (75.2%) | 0 | 6 (0.6%) | 223 (22.8%) | 13 (1.4%) | 976 | |||||
| 6. North Carolina | 0 | 574 (71.5%) | 0 | 9 (1.1%) | 200 (24.9%) | 20 (2.5%) | 803 | |||||
| 7. Alabama | 0 | 623 (85.0%) | 0 | 11 (1.5%) | 94 (12.8%) | 5 (0.7%) | 733 | |||||
| 8. California | 54 (7.5%) | 74 (10.3%) | 82 (11.4%) | 47 (6.5%) | 432 (60.1%) | 30 (4.2%) | 719 | |||||
| 9. South Carolina | 0 | 475 (71.1%) | 0 | 0 | 183 (27.4%) | 10 (1.5%) | 668 | |||||
| 10. Louisiana | 1 (0.2%) | 457 (69.4%) | 3 (0.5%) | 3 (0.5%) | 147 (22.3%) | 47 (7.1%) | 658 | |||||
| 11. Arkansas | 0 | 277 (55.2%) | 1 (0.2%) | 54 (10.8%) | 152 (30.2%) | 18 (3.6%) | 502 | |||||
| 12. Ohio | 1 (0.2%) | 132 (29.8%) | 0 | 6 (1.4%) | 300 (67.7%) | 4 (0.9%) | 443 | |||||
| 13. Kentucky | 0 | 232 (54.5%) | 0 | 1 (0.2%) | 177 (41.5%) | 16 (3.8%) | 426 | |||||
| 14. Florida | 0 | 230 (62.7%) | 3 (0.8%) | 1 (0.3%) | 129 (35.1%) | 4 (1.1%) | 367 | |||||
| 15. New Jersey | 3 (0.8%) | 116 (32.1%) | 0 | 2 (0.6%) | 209 (57.9%) | 31 (8.6%) | 361 | |||||
| 16. Illinois | 0 | 81 (22.5%) | 6 (1.7%) | 4 (1.1%) | 224 (62.2%) | 45 (12.5%) | 360 | |||||
| 17. Mississippi | 0 | 274 (76.8%) | 0 | 1 (0.3%) | 73 (20.4%) | 9 (2.5%) | 357 | |||||
| 18. Massachusetts | 3 (0.9%) | 32 (9.3%) | 6 (1.7%) | 27 (7.8%) | 210 (60.9%) | 67 (19.4%) | 345 | |||||
| 19. Missouri | 0 | 128 (37.6%) | 1 (0.3%) | 2 (0.6%) | 187 (55%) | 22 (6.5%) | 340 | |||||
| 20. Tennessee | 0 | 215 (64.2%) | 0 | 2 (0.6%) | 100 (29.8%) | 18 (5.4%) | 335 | |||||
| 21. Maryland | 0 | 208 (66.7%) | 1 (0.3%) | 1 (0.3%) | 89 (28.5%) | 13 (4.2%) | 312 | |||||
| 22. Oklahoma | 1 (0.5%) | 54 (29.5%) | 2 (1.1%) | 37 (20.2%) | 86 (47%) | 3 (1.7%) | 183 | |||||
| 23. West Virginia | 0 | 77 (49.7%) | 0 | 0 | 70 (45.2%) | 8 (5.2%) | 155 | |||||
| 24. Indiana | 0 | 31 (22.1%) | 0 | 0 | 106 (75.7%) | 3 (2.1%) | 140 | |||||
| 25. Arizona | 4 (3.2%) | 13 (10.3%) | 33 (26.2%) | 10 (7.9%) | 63 (50%) | 3 (2.4%) | 126 | |||||
| 26. Connecticut | 2 (1.6%) | 7 (5.6%) | 0 | 10 (7.9%) | 103 (81.7%) | 4 (3.2%) | 126 | |||||
| 27. Oregon | 3 (2.4%) | 5 (4.0%) | 2 (1.6%) | 17 (13.7%) | 97 (78.2%) | 0 | 124 | |||||
| 28. DC | 0 | 80 (67.7%) | 0 | 0 | 36 (30.6%) | 2 (1.7%) | 118 | |||||
| 29. Washington | 7 (6.4%) | 8 (7.3%) | 1 (0.9%) | 9 (8.3%) | 84 (77.1%) | 0 | 109 | |||||
| 30. Colorado | 0 | 7 (6.9%) | 14 (13.7%) | 0 | 63 (61.8%) | 18 (17.6%) | 102 | |||||
| 31. Deleware | 0 | 40 (53.3%) | 0 | 1 (1.3%) | 26 (34.7%) | 8 (10.7%) | 75 | |||||
| 32. Montana | 2 (2.7%) | 9 (12.3%) | 1 (1.4%) | 5 (6.9%) | 56 (76.7%) | 0 | 73 | |||||
| 33. Nevada | 3 (4.1%) | 4 (5.5%) | 4 (5.5%) | 6 (8.2%) | 45 (61.6%) | 11 (15.1%) | 73 | |||||
| 34. New Mexico | 0 | 5 (6.8%) | 42 (57.5%) | 0 | 18 (24.7%) | 8 (11.0%) | 73 | |||||
| 35. Minnesota | 0 | 1 (1.5%) | 0 | 40 (60.6%) | 25 (37.9%) | 0 | 66 | |||||
| 36. Kansas | 0 | 6 (10.5%) | 0 | 3 (5.3%) | 39 (68.4%) | 9 (15.8%) | 57 | |||||
| 37. Rhode Island | 0 | 3 (5.8%) | 0 | 3 (5.8%) | 42 (80.7%) | 4 (7.7%) | 52 | |||||
| 38. Hawaii | 45 (91.8%) | 0 | 3 (6.1%) | 0 | 1 (2.1%) | 0 | 49 | |||||
| 39. Utah | 0 | 3 (6.1%) | 2 (4.1%) | 2 (4.1%) | 42 (85.7%) | 0 | 49 | |||||
| 40. Iowa | 0 | 7 (15.6%) | 0 | 0 | 38 (84.4%) | 0 | 45 | |||||
| 41. Nebraska | 0 | 4 (11.8%) | 0 | 1 (2.9%) | 25 (73.5%) | 4 (11.8%) | 34 | |||||
| 42. Idaho | 1 (3.7%) | 2 (7.4%) | 0 | 1 (3.7%) | 23 (85.2%) | 0 | 27 | |||||
| 43. Vermont | 0 | 1 (3.8%) | 0 | 0 | 24 (92.4%) | 1 (3.8%) | 26 | |||||
| 44. New Hampshire | 0 | 1 (4.2%) | 0 | 0 | 22 (91.6%) | 1 (4.2%) | 24 | |||||
| 45. Wyoming | 2 (8.7%) | 2 (8.7%) | 1 (4.3%) | 1 (4.3%) | 15 (65.3%) | 2 (8.7%) | 23 | |||||
| 46. Maine | 0 | 3 (14.3%) | 0 | 2 (9.5%) | 16 (76.2%) | 0 | 21 | |||||
| 47. South Dakota | 0 | 2 (13.3%) | 0 | 5 (33.3%) | 7 (46.7%) | 1 (6.7%) | 15 | |||||
| 48. Michigan | 0 | 1 (7.7%) | 0 | 7 (53.9%) | 5 (38.4%) | 0 | 13 | |||||
| 49. Alaska | 0 | 2 (16.7%) | 0 | 6 (50.0%) | 4 (33.3%) | 0 | 12 | |||||
| 50. North Dakota | 0 | 1 (12.5%) | 0 | 0 | 6 (75%) | 1 (12.5%) | 8 | |||||
| 51. Wisconsin | 0 | 0 | 0 | 0 | 1 (100%) | 0 | 1 | |||||
| Totals: | 147 | 7,353 | 349 | 362 | 6,344 | 714 | 15,269 | |||||